Installation of the Azure Monitor Agent for WVD, RDS and Citrix sites
The installation is very simple. It only takes two steps to achieve the goal: Install the agent and configure your Azure Monitor / Log Analytics workspace. To make it easy for anyone, here are the two steps as a detailed guide.
Notes
If you are using Azure Monitor for WVD V1.x.x visit this site: Installation 1.3.6 and below
Prerequisites
We offer the Azure Monitoring Agent for testing and community purposes without any warranty nor support. Please test the monitoring solution and decide if you will continue the community edition or if you want to run fully supported, including premium features, updates, and support for building KUSTO queries. Visit sepago Shop for more information or get your special quote from sales@sepago.de.
From agent version > 2.4.0: From version 2.4.0 the standard version of Azure Monitor for WVD and Citrix will now support all premium features like encryption for secrets, user input delay metrics, and GPU measuring. If the agent is not licensed, a splash screen will appear for a few seconds in any new user session after logging in. If you want to test this solution in a production environment, ask for a trial key to avoid the splash screens.
You can use the agent on Microsoft Windows Virtual Desktop session hosts, Citrix Sites version 7.x and maybe above including Citrix Cloud. The agent is tested on Windows Server 2008R2/2012R2/2016 and Windows 7-10 (64 Bit only). If you use it on a VDI, the total network transmission performance and logon duration are not monitored.Rollout the Azure Monitor solution into your subscription
We made it simple for you. Use the Azure Marketplace to rollout your Azure Monitor for WVD or Citrix directly into your Azure subscription:
Alternatively, roll out your workspace including all tiles, views and workbooks via GitHub https://github.com/MarcelMeurer/LogAnalytics-for-Citrix-and-RDS
Install the Azure Monitor Workbooks in an existing workspace
If you have an existing workspace you want to use further or if the installation from the market place is missing the Azure Monitor Workbooks, you can add the workbooks or update older workbooks with the following link: Workbooks installation
Please install the workbooks into the same resource group as your Azure Monitor/Log Analytics workspace.
Deploy the agent to a session host/worker
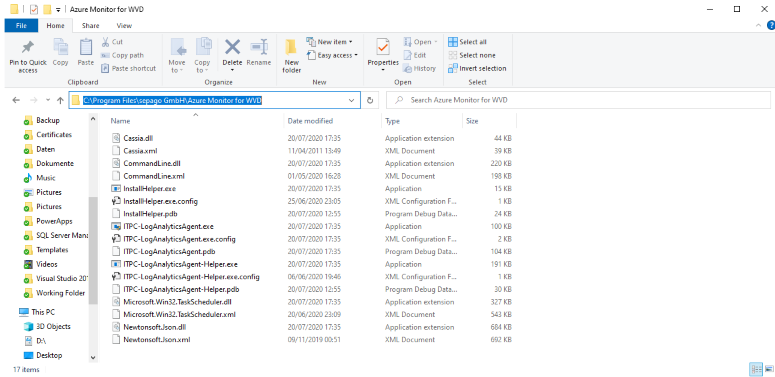
- Unzip your download and copy the files to folder
C:\Program Files\sepago GmbH\Azure Monitor for WVD of one of your session hosts or Citrix Workers.
Configure the agent
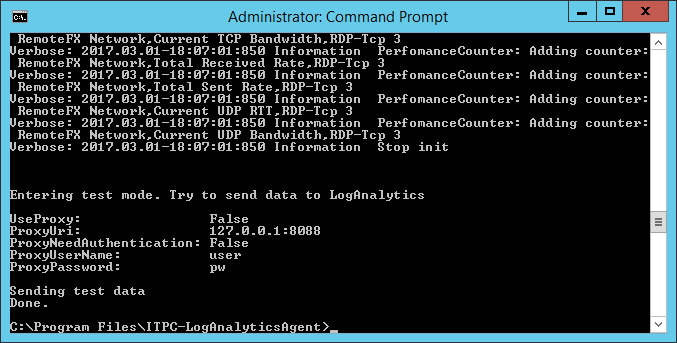
First, test if a connection to your Log Analytics Workspace / Azure Monitor can be established. Run:
If the connection can be established, store the parameter to the registry and register the agent to start with your virtual machine:
You have to install the agent to all session hosts/workers in your environment. It's recommended to do this once on a template VM you are using as a golden image for your environment or using a software distribution solution.
Optional: If you have a valid license key, include it in your configuration with -l "license key". E.g:
The configuration is stored in the registry at HKEY_LOCAL_MACHINE\SOFTWARE\sepago\Azure Monitor for EUC. Keys and passwords are encrypted to prevent abuse.
Hint: You can find your customerId and SharedKey if you open your Azure Monitor / Log Analytics workspace and click "Advanced Settings -> Settings". Use workspace id and primary key.
Optional configuration and command-line parameters
The agent has several other options to configure. Configure this if needed via the command-line. To get the list of parameters run
--CustomerId - enter your workspace id (mandatory)--SharedKey - enter your primary key of your workspace (mandatory)--UpdateIntervalInSeconds - time in seconds the agent sends data to your workspace (default: 60, recommended)--UseProxy - enable using a proxy for uploading data (default: false)--ProxyUri - proxy URL, if you use a web proxy--ProxyNeedAuthentication - logon to a proxy is requiered (default: false)--ProxyUserName - user name for a proxy authentication--ProxyPassword - password for a proxy authentication--UseHashesInsteadUserNames - if set, user names will be hashed / pseudo anonymization (default: false)--DataUploadEndpoint - optional: sets the data entpoint to another Azure resource. E.g. for Azure US Government Cloud use: -DataUploadEndpoint ods.opinsights.azure.us
Logs
The agent is installed as a scheduled task "ITPC-LogAnalyticAgent for RDS and Citrix" to start with the VM. The agent writes a log file into the installation folder. Default:
You are ready now. For the first time, it takes some hours to see the data in Log Analytics. Be patient: When the data scheme is created and the first data are indexed it works fast.